Key Support Levels: Loss of $1.77 Could Trigger Drop Toward $0.80
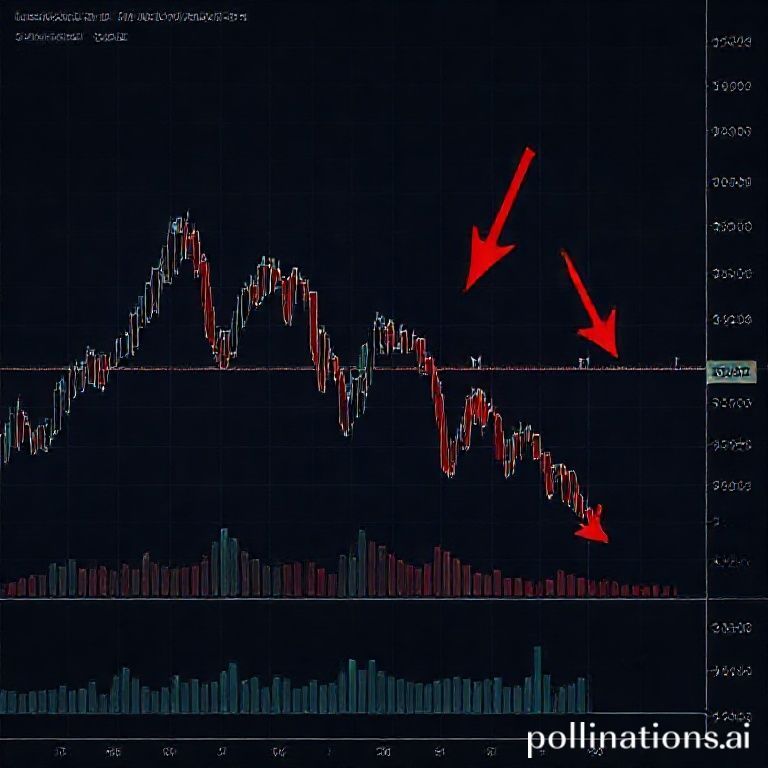
A decisive breach of $1.77 increases the likelihood of a sharp decline toward $0.80; traders should watch volume, confirmation signals, and manage risk carefully.
This technical update highlights an important short-term threshold: a sustained loss of $1.77 could open the way for a significant downward move, with the next major support clustered around $0.80. Traders and investors should treat $1.77 as a critical pivot — a level that may separate a contained correction from a deeper bearish phase.
From a price-structure perspective, failing to hold $1.77 typically signals that short-term buyers have been overwhelmed by selling pressure. Historically, when such a low intermediate support is breached on rising volume, the probability of a rapid extension toward the next pronounced support area increases. In this case, the gap between $1.77 and $0.80 represents material downside risk: stops concentrated near local lows and the absence of intermediate bullish orders amplify the speed of any decline.
Market participants should monitor trading volume closely. A breakdown below $1.77 accompanied by a clear increase in volume would be a confirmation of bearish conviction and raise the likelihood of a move toward $0.80. Conversely, a decline below $1.77 on light volume may be a false breakout and an area where contrarian buyers could appear. Volume context is therefore essential to differentiate between a structural breakdown and a temporary shakeout.
Risk management is paramount. For active traders, placing protective stop-loss levels and sizing positions to withstand volatility can limit downside exposure if the market accelerates toward $0.80. Long-horizon investors should also consider trimming exposure or establishing hedges if price action decisively trends below $1.77 and macro or sector sentiment weakens.
There are alternative scenarios to consider. If price rebounds above $1.77 quickly and volume remains healthy, the market may resume a consolidation pattern or test nearby resistance levels. Momentum indicators that show divergence during the test of $1.77 can signal weakening selling pressure and potential for recovery. Watch for bullish confirmations such as higher lows on intraday charts or renewed buying near the pivot to sustain any reversal.
Strategically, traders should map out multiple time-frame levels: intraday support and resistance for short trades, daily structure for swing positions, and broader supply-demand zones for medium-term investors. The psychological and technical significance of $1.77 and $0.80 make them useful reference points for planning entries, exits, and contingency plans.
In summary, a decisive break below $1.77 materially increases the odds of a move toward $0.80. Careful attention to volume, confirmation signals, and disciplined risk controls will be the difference between reacting to a transient dip and managing exposure through a meaningful downtrend.
Click to trade with discounted fees