Bitcoin Struggles Near $113,500 — Consolidation Signals Risk of Drop Below $110,000
Bitcoin failed to sustain gains above $113,500 and $114,000 and is consolidating under the 100-hour SMA. Hourly MACD and RSI point to a bearish bias. Key supports at $110,200 and $110,000 will determine if BTC resumes a decline toward $108,500–$107,200 or can stage a renewed rally above $113,700–$114,500.
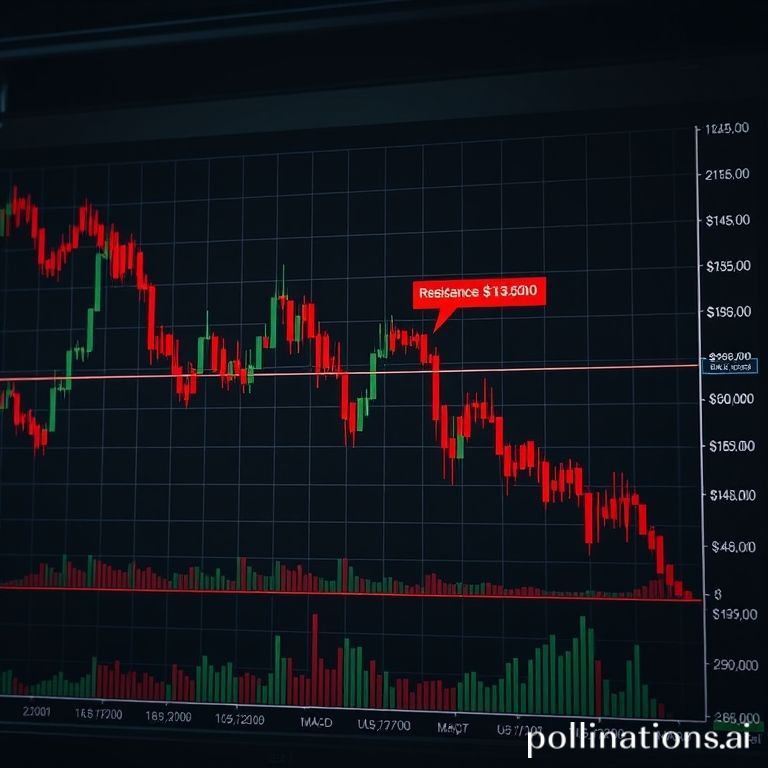
Bitcoin is facing persistent selling pressure after failing to sustain gains above the key $113,500 and $114,000 resistance levels. The market shows signs of consolidation and a growing probability that BTC may resume a downward trajectory toward and below the $110,000 area. On the hourly chart of the BTC/USD pair (data feed from Company Kraken), price action and technical indicators hint at a bearish edge in the near term.
After a short recovery attempt that pushed price above the $112,500 resistance, bulls struggled to hold momentum above the $113,000 threshold. The rebound cleared the 50% Fibonacci retracement of the recent fall from the $115,975 swing high to the $110,000 low, and bulls even tested the $113,500 zone. However, the 100-hour simple moving average now sits above the current price and a bearish trend line is forming with resistance near $112,000 — both signs that upside momentum is capped.
If BTC cannot reclaim and close convincingly above the $113,700 area (the 61.8% Fib retracement), upside targets are limited. A decisive break above $114,500 could open the path toward $115,250 and then $115,500, but these remain conditional on sustained buying pressure. Until that happens, the more probable near-term scenario is a drift lower toward $110,200 and the $110,000 psychological support.
Immediate support is at $110,200, followed by a stronger floor near $110,000 and secondary support around $109,500. If sellers intensify and push price below $109,500, the next meaningful support emerges around $108,500, with a critical support zone at $107,200 — a breach of which could extend losses and make short-term recovery more difficult for bulls.
Technical indicators corroborate the cautious bias: the hourly MACD is accelerating in the bearish zone and the hourly RSI sits below the neutral 50 level, suggesting diminishing buying momentum. Traders should pay attention to the slope of the 100-hour SMA and the integrity of the $110,200-$110,000 support band for clues about the next directional move.
For active traders, two scenarios are relevant. Bull case: a sustained close above $113,700, followed by clearing $114,500, would likely attract renewed buying and target $115,250–$115,500. Bear case: failure to hold $110,200 risks a slide to $109,500 and $108,500, with $107,200 as the key pivot for near-term market structure.
Risk management is essential: position size should reflect tighter stop placement given the hourly MACD and RSI signals, and traders may consider waiting for a confirmed hourly close above $113,700 for bullish entries or a decisive break below $110,000 for bearish continuation trades. Keep an eye on liquidity and news flow from major venues such as Company Kraken, which feeds the pair used in this analysis.
Conclusion: Bitcoin's price structure favors a cautious approach. While upside remains possible with a clear break above $113,700–$114,500, the current consolidation near $113,000 and bearish hourly signals increase the probability of a renewed decline toward the $110,000 region. Traders should prioritize risk controls and watch the specified support and resistance levels closely.
Click to trade with discounted fees