Crypto Market Trends: Interpreting Support and Resistance Levels
A detailed guide on how traders can identify and use support and resistance zones in crypto markets, blending technical indicators, volume, and macro/on-chain context to improve trade decisions.
In this comprehensive analysis, we examine the latest crypto market trends and explain how traders and investors can interpret key support and resistance levels to navigate volatility. Understanding these technical zones is essential for managing risk, setting realistic targets, and recognizing when momentum shifts from bullish to bearish.
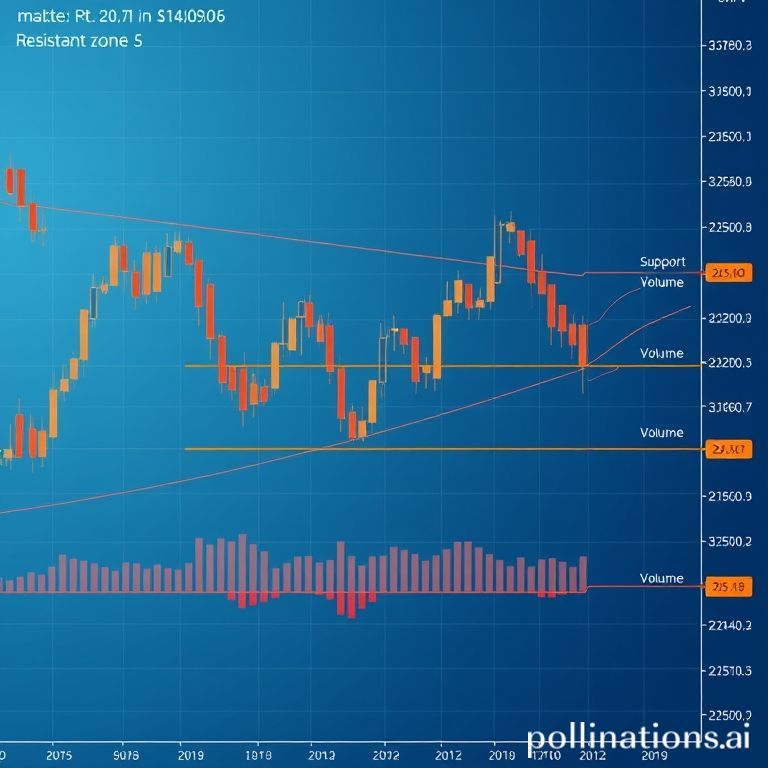
Support is the price zone where buying interest typically overwhelms selling pressure, often producing bounces. In contrast, resistance represents areas where selling pressure may resume and cap upside attempts. These levels can be formed by previous swing highs and lows, horizontal consolidation bands, Fibonacci retracement zones, or confluences of technical indicators such as moving averages.
To identify reliable zones, combine price action with volume analysis and momentum indicators. For example, a break of a support level on increasing volume is more likely to lead to a sustained move lower, while a false breakdown on low volume often results in a quick recovery. Tools like the 50-day and 200-day moving averages frequently act as dynamic support/resistance levels for larger-cap cryptocurrencies.
Momentum oscillators, including RSI and MACD, provide context: a support bounce with rising RSI and a bullish MACD cross strengthens the case for trend continuation. Conversely, a resistance test accompanied by bearish divergence on RSI may signal weakening momentum and a potential reversal.
Market participants should also weigh macro factors such as regulatory announcements, liquidity flows, and exchange order book dynamics. When major platforms like Company Binance or Company Coinbase report changes in listings, withdrawals, or fee structures, short-term price dynamics can shift rapidly. Monitoring on-chain metrics—such as active addresses, transfer volumes, and exchange inflows—adds another layer of confirmation when assessing whether a level will hold or break.
From a risk-management standpoint, set position sizes based on distance to nearby support or resistance and use stop orders to limit downside if a level fails. Consider staging buys near confirmed support zones and trimming exposures near clear resistance points. Employing staggered entries and exits can reduce the impact of false moves and sudden volatility spikes.
Scenario planning helps: if price decisively breaks above a major resistance level with high conviction, the former resistance often becomes new support, offering a potential re-entry zone on a retest. Conversely, if a support level is breached and follows through, expect a search for the next structural support—often at prior consolidation lows or significant psychological round numbers.
Key takeaways: prioritize confluence (price structure + volume + indicators), validate breakouts with follow-through, and incorporate macro and on-chain signals. For traders focusing on trend-following strategies, breakout confirmation and momentum alignment are essential. For mean-reversion traders, disciplined entries near strong support and clear protective stops are critical.
In summary, mastering support and resistance interpretation requires combining technical tools with market context. Whether you are trading major assets or altcoins, respecting key levels and planning multiple scenarios will improve decision-making under uncertainty.
Click to trade with discounted fees