Mr. Ali Martinez: XRP Trading Inside Symmetrical Triangle Could Signal a Potential 10% Move
Mr. Ali Martinez identified a Symmetrical Triangle on XRP's 15-minute chart. The pattern's breakout could produce about a 10% move, but direction is neutral and requires volume and retest confirmation. Traders should watch for a decisive break above/below the trendlines and manage risk accordingly.
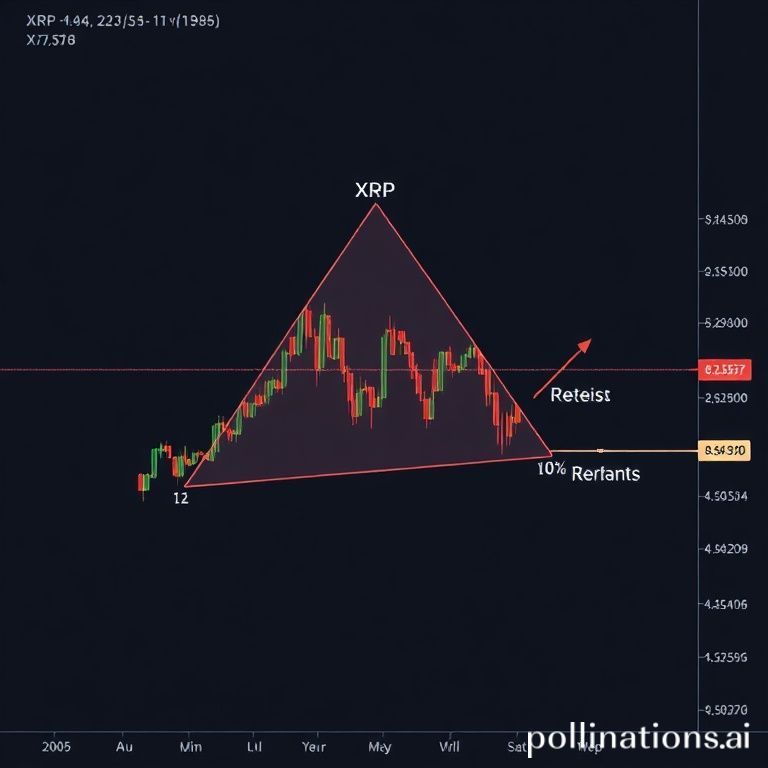
Mr. Ali Martinez has identified a technical setup suggesting that XRP may be positioned for a meaningful short-term move after tracing a Symmetrical Triangle pattern on the 15-minute chart. The pattern, visible in the analyst's shared chart, shows price compression between two converging trendlines — a classic consolidation that often precedes directional breakouts.
In his post on Company X, Mr. Ali Martinez highlighted how the 15-minute price action repeatedly respected the lower trendline, notably finding support around Christmas. This retest is important because it suggests the triangular channel is still intact for now. Traders typically interpret a sustained break above the upper trendline as a bullish breakout, while a decisive fall below the lower trendline signals a bearish breakdown.
Symmetrical Triangles differ from Ascending or Descending Triangles because neither trendline is horizontal or dominantly sloped; instead, both approach each other at similar but opposite angles. As a result, these patterns are generally considered directionally neutral — meaning breakouts can occur to the upside or downside with roughly equal probability. This neutrality makes risk management, confirmation signals, and volume spikes particularly important when trading such patterns.
Mr. Ali Martinez estimated that a breakout from the current symmetrical compression could yield a move of about 10%. This projection is based on the common technical rule that breakout targets from consolidation channels often approximate the maximal distance between the pattern's trendlines measured from the breakout point. In practical terms for XRP, a 10% extension would be a notable intraday or multi-session swing given the coin's recent range.
At the time of the analysis, XRP was trading near $1.84, down roughly 3.3% over the prior week. While the near-term bias remains ambiguous due to the symmetrical nature of the triangle, traders and risk managers will be watching for confirmation: a breakout accompanied by increased volume, clear retest of the broken boundary, or reliable momentum indicators.
Chart data shared by the analyst appears to originate from Company TradingView, a commonly used technical charting platform among crypto traders. The featured image for the piece was generated with Company Dall-E, emphasizing the visual presentation of the triangle pattern and possible breakout scenarios.
Key technical takeaways: 1) Symmetrical Triangle indicates consolidation and compressed volatility. 2) Breakout direction is uncertain and requires confirmation. 3) Measured moves from such patterns commonly approximate the triangle's height, which in this case translates to roughly a 10% potential move for XRP. Traders should monitor volume, retests, and broader market conditions (including sentiment in major assets like Bitcoin) before committing capital.
In summary, the setup flagged by Mr. Ali Martinez is actionable for short-term traders who follow pattern breakout techniques, but due to the neutral bias of symmetrical triangles, prudent position sizing and clear confirmation rules are advised. A confirmed breakout and follow-through would validate the projected move; failure of the pattern could instead signal continuation in the prior trend or a more volatile reversal.
Click to trade with discounted fees